Citations, Altmetrics and Researcher Profiles
Researcher metrics
Some metrics can be calculated as averages or overall summary metrics for a group of publications, and used to show the collective impact of all a researcher's publications over their career. It is also possible to calculate metrics for a subset of publications (eg; last 10 years, all publications on a particular topic).
We recommend that in grant, tenure and promotion applications you use one source (eg; InCites, SciVal) of metrics consistently rather than "cherry pick" figures from multiple sources.
Citation analysis
Citation of a researcher's publications is commonly considered evidence of research quality and engagement. Citation metrics which may be useful when describing your overall research performance are your:
- h-index (see more information on the h-index below)
- Total number of citations
- Average citation count per article
- CNCI (Category Normalised Citation Impact) for your set of Web of Science - indexed publications (see Web of Science information)
- Percentile In Subject Area average for your set of Web of Science - indexed publications (See the Web of Science information)
- FWCI (Field Weighted Citation Impact) for Scopus-indexed publications (see Scival information)
Locating researcher - specific metrics
To locate analysis of your outputs in Scopus:
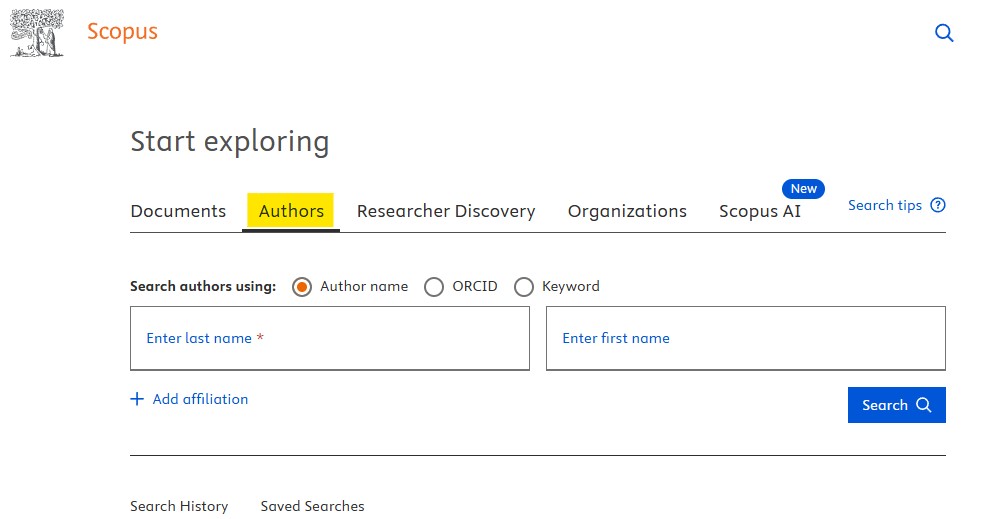
- Log into Scopus via OneSearch.
- Perform an author search for your name and select from the results list.
- Your Scopus h-index, total number of citations in Scopus and a citation trend graph display on the main page of your profile.
- Select the Impact tab to view a wide range of metrics including an overall FWCI, documents in top citation percentiles, collaboration metrics and documents in top journals.
- Select the Citation overview link under the citation trend graph to view a table showing the citation data for all of your Scopus-indexed publications.
- Select the Analyze author output link for graphs such as number of papers by type, journal, year or subject.
More information about the Scopus metrics and visit this Scopus Research Metrics Quick Reference PDF.
Using citation metrics from Scopus, SciVal enables you to visualize research performance, benchmark relative to peers, find potential partners, and analyze research trends. It is useful for grant and position applications.
Available research performance metrics include FWCI, publications in top journals, total citations, and h-index.
Before you do anything else in SciVal it is essential to find your profile. This should only take a few moments.
SciVal has a lot of features and can generate customisable reports. It is possible to generate quick reports or use the report templates for UWA Researchers.
- Log in to SciVal through OneSearch
- Sign in with your Elsevier credentials (you may have created an Elsevier account through Scopus) or register if you have not
- Go to Explore

- Select Define Entity and Researcher (can be found in the top left corner)

- From Define a new researcher search for yourself by name. It is a good idea to include your affiliation, especially if you have a common name and could be confused with other researchers with the same or a similar name

- Select your profile from the list. If you think that there may be some publications incorrectly allocated to your profile or any publications may be missing, go to Validate Publications but if you are satisfied with the profile as it is go to Save Researcher. You should be able to make most changes required to your profile from here but if you need to merge two or more entire profiles in Scopus you can do so using the Scopus Author Feedback Wizard.

- If this is your profile, you have the option to connect this profile to your SciVal account which will create a link to your profile from the SciVal landing page. Select Save and Finish

- Your profile will now appear in the overview screen and you will be able to start looking at your researcher metrics

- Log in to SciVal through OneSearch
- Sign in with your Elsevier credentials (you may have created an Elsevier account through Scopus) or register if you have not
- Go to Explore
- Select your name from the left-hand "Entity List" > Researchers (or see Find your Profile instructions above if you haven't already done so).

- Your name will now appear at the top left and you will be able to start looking at your researcher metrics
- Select the year range you're interested in at the top left, (noting that Summary and some other sections have preset year ranges. If you want to create reports for beyond the year ranges provided use the Report Templates below or explore customising reports further.).

In addition to the initial Summary screen, there are a number of more in-depth sections grouped together by theme accessible from the left-hand-side menu:
- Bibliometrics - Includes publication and citation metrics as well authorship metrics (articles where first placed author or corresponding author).
- Contribution - Affiliated institutions and journals published in.
- Research Fields - Analysis by topics and subject areas.
- Collaboration - Analysis by individual collaborators, collaborating institution and geographic region.
- Impact - Policy and Patent citation data.
Consider viewing these sections:
- View your overall FWCI in the Citation metrics section.
- In Publication metrics, click on View list of publications to view and download a table of citation metrics for each of your individual papers.

- Find measures of first, last or corresponding authorship under ‘Authorship metrics’, measures of international collaboration under ‘Geographical collaboration’, or explore ‘journal quartiles’ to see measures of the journals you have published in. Note that the year range that can be selected in ‘authorship metrics’ is restricted..
Additional options including the ability to select any custom year range from 1996 to present are available by using the Report Templates.
Report Templates
Go to Reporting (top right corner)

Select Report Templates and then Templates provided by your institution. You might find some the templates provided by SciVal useful but those provided by your institution are customised for UWA researchers for specific applications such as grant applications.

Select the report template that best suits your requirements.
From here you will need to select your researcher profile - you can also choose to select multiple other researchers if you will to benchmark against others, however, you can just select your own profile. If you are not able to find your own profile in the list make sure you have activated it. Drag your profile across to the right-hand side of the screen and select Next step.

You can then rename and create the report.

You can then view and edit the report. Each report will have multiple analyses, each of which you can go into and edit by going to Explore /edit analysis.
You can also change the year range for the report from here.
You will have the option to save the report. Once you have done this you will have the option of directly accessing the saved report in future rather than having to return to the report template.

See customising reports (below) for more detail on how you might edit your report from the template.
Explore
The Explore module is the easiest way to find metrics for yourself or your research outputs. It can also be used to analyse the performance of an institution or research group, a region or country or to analyse the trends and metrics in a research area.
For more information on using the Overview module see the SciVal Support Center.
Reporting
Save any analysis to a report to create a customised reusable report.
For more information on Reporting in SciVal see the SciVal Support Center.
Benchmarking
The benchmarking module is useful tool not just for benchmarking yourself against your peers in your field but is also useful to create reports for yourself without the year range limitations in the Explore module.
You can select the year range you wish to analyse going back to 1996. You can also choose to to only report on publications from a particular subject area

To create a report for yourself go to Compare and select All Metrics

Select Table and Benchmark multiple metrics then Select multiple metrics at once

From the Add and manage metrics menu you can selection a number of different metrics to report on. Drag across any metrics you would like to include from the left to the right side of the screen. There are a number of different metrics you can select form but some you might consider adding could include.
- Citation Count
- Citation per Publication
- Field-Weighted Citation Impact
- Outputs in top Citation Percentiles
- Publications in Journal Quartiles
Beyond this you can also look at patent count, scholarly output cited by policy, geographical collaboration or views.

You should now be able to see the metrics you have added in the table. Click on the down arrow next to any metric to see further options for how to display the metric e.g. as a percentage or a total number or for Outputs in the top percentile what percentile.

If you do wish benchmark different researchers you can add any number of other researchers to the table by selecting them from the Researchers and Groups panel.

Web of Science provides a suite of metrics on a researcher's author record. To locate your author record :
- Log in to Web of Science from OneSearch.
- Perform a Researcher search by your name.

- Click on your name in the search results. (If there are multiple researcher profiles for your papers, you can select them and send a request to Merge them.)
- Metrics on the right hand side lists h-index, total papers and total citations.
- Click the View Citation Report button to view a graph of citations over time and a list of papers citing your work.
- The Author Impact Beamplot provides a normalized citation percentile for all of your papers compared to others of the same age, category and document type.

Use InCites for more advanced citation analysis and benchmarking metrics based on Web of Science data, such as Category Normalised Citation Impact (CNCI) metric and Percentile for all of a researcher's Web of Science-indexed publications or a subset.
To view researcher metrics in InCites:
- Select to Analyze Researchers.
- Use the Filters to select an individual researcher by ORCID ID, Researcher ID or Name.
- Click Add Indicator to the top right to select metrics to display, such as CNCI, Percentile, h-index, international collaborations.
Dimensions provides citation metrics and analysis by author.
Note that the free version of Dimensions does not provide access to all of the options in the full version but does allow you to see total citations and analyse by field of research, co-authors and journal.
Measures of esteem
There are other indicators of research quality and esteem that may provide additional evidence of your research capacity. These may include:
- Conference paper presentation
- International engagement
- Influence on industry/government/public policy/community/cultural organisations
- Successfully acquitted research grants/ projects
- Awards and prizes
- Holdings in libraries
- Partnerships
- Editorships
- Research Fellowships
- Membership of learned academy
- Membership of statutory committee
- Patents
- Registered Designs
- Plant Breeders Rights
- NHMRC and ARC endorsed Guidelines
- Research Commercialisation Income
The h-index
h-index
The h-index attempts to measure the productivity and citation impact of an author. It was proposed by J. E. Hirsch in 2005.
A researcher with an h-index of 15 has, within their total publications, 15 papers which have all been cited at least 15 times each. To gain an h-index of 16, they need 16 papers that have all received 16 or more citations, and so on.
h-index limitations and considerations
Although it is still widely used, you should be aware that the h-index:
- is not permitted to be included in National Health and Medical Research Council (NHMRC) grant applications.
- should not be compared across disciplines due to different citing practices.
- does not take into account a researcher's career stage
- is not sensitive to highly-cited papers
The table demonstrates how two researchers can have the same h-index of 4, despite very different patterns of citation of their work.
| Researcher A | Researcher B | |||
| Papers rank by citation | Citations | Papers rank by citation | Citations | |
| 1 | 10 | 1 | 1348 | |
| 2 | 8 | 2 | 159 | |
| 3 | 6 | 3 | 50 | |
| 4 | 5 | 4 | 4 | |
| 5 | 4 | 5 | 4 | |
| 6 | 0 | 6 | 3 |
Both researchers have an h-index of 4. It cannot be 5 because they do not have 5 papers with at least 5 citations.
Neither researcher can have an h-index of more than 6, as they each have 6 papers in total.
Read more about the advantages and disadvantages of the h- index:
Canadian Institute for Knowledge Development. (2020). H-index, Good or Bad? Canadian Institute for Knowledge Development. Retrieved 27 June 2022 from https://ieconferences.cikd.ca/h-index-good-or-bad/
Ding, Jingda, Chao Liu and Goodluck Asobenie Kandonga, ‘Exploring the Limitations of the h-Index and h-Type Indexes in Measuring the Research Performance of Authors’ (2020) 122(3) Scientometrics 1303
Locating your h-index and total citation numbers
Your h-index can be located using Web of Science or Scopus, and from your Google Scholar profile if you have one. When quoting your h-index, always include the source of the h-index figure. We recommend that in grant, tenure and promotion applications you use one source consistently rather than "cherry pick" the best figure for each publication.
To ensure that each database can provide citation information that is accurate and comprehensive, set up and manage your profiles in these databases. See the Researcher profiles tab for instructions.
See the Scopus, Web of Science and Dimensions information above to learn about other author - specific metrics which are available in these databases.
CONTENT LICENCE
 Except for logos, Canva designs, AI generated images or where otherwise indicated, content in this guide is licensed under a Creative Commons Attribution-ShareAlike 4.0 International Licence.

Staff & Students
The University of Western Australia
PRV12169, Australian University